Maps
Prioritizing Improvements to Metro Bus Stops
Unpleasant or challenging bus stop environments negatively impact riders
When faced with a bus stop that is inadequately lit or shaded, riders may choose longer or more costly alternative routes, avoid taking the bus in favor of the safety and comfort of a personal vehicle, or not take a trip altogether.
Unpleasant bus stop environments pose particular challenges for women, elderly people, people with disabilities, and those traveling with small children. Inadequate bus stops also disproportionately impact low-income and BIPOC populations, who are more likely to be reliant on public transit.
Metro envisions bus stops functioning as community assets
Bus stops should inform users of upcoming arrivals or service disruptions; they should shelter riders from heat and rain; and they should be activated and transformed into points of civic pride.
In response to the current state of municipal bus stops, riders and the Metro Board call for bus stops that are functional, safe and accessible to everyone. Metro is actively working to address bureaucratic and operational challenges that limit our ability to manage and maintain existing infrastructure and to fund and design improvements across our vast service area.
Lighting
Adequate lighting at bus stops plays a critical role in rider perceptions of safety and security. According to Metro’s 2019 Understanding How Women Travel report, safety when using transit is a top concern among surveyed travelers, with 60 percent of female riders reporting feeling safe using Metro during the day but just 20 percent feeling safe at night. Improved lighting at bus stops can play a key role in improving perceptions of safety. Municipalities should provide strong levels of illumination that are uniformly distributed throughout bus stops to positively influence riders’ sense of safety and security while waiting for the bus.
Urban Heat
In the U.S., extreme heat kills more people than any other natural disaster. As Southern California will experience increasingly long and hot summers in the coming decades, Angelenos will become increasingly vulnerable to the negative extreme heat, which will disproportionately impact elderly, young and BIPOC populations. Shade can play a key lever in mitigating against extreme heat. Shade can reduce peoples’ experience of heat stress and can lower temperatures by almost 10 degrees. Municipalities can provide shade to bus stops through installing much-needed bus shelters: as of 2022, just 24% of bus stops in Los Angeles County have shelters. Municipalities can also plant street trees and other vegetation, which provide natural cooling and shade.
Equity Focus Communities (EFCs)
Equity Focus Communities (EFCs) refer to a designation adopted by Metro in 2019 (and revised in 2022) to identify where transportation needs are greatest. EFCs identify and focus improvements on locations where there are higher concentrations of resident and household demographics associated with the following factors:
- Mobility barriers (households earning less than $60,000 per year)
- Black, Indigenous, or people of Color (BIPOC) populations
- Households that do not have a car
A disproportionate number of Metro riders live in EFCs relying on Metro bus service to travel to work and school, making bus stop improvements in EFCs that much more critical.
High Injury Network
High injury networks (HINs) identify roadway stretches where high concentrations of fatal or serious injuries occur in a transportation system. According to the Southern California Association of Governments’ (SCAG) HIN, 65% of all fatal and series injuries occurred in just 5.5% of the region’s transportation network. Local agencies can use HINs to help direct critical resources and investments to improve safety and reduce the risk of traffic injuries or fatalities.
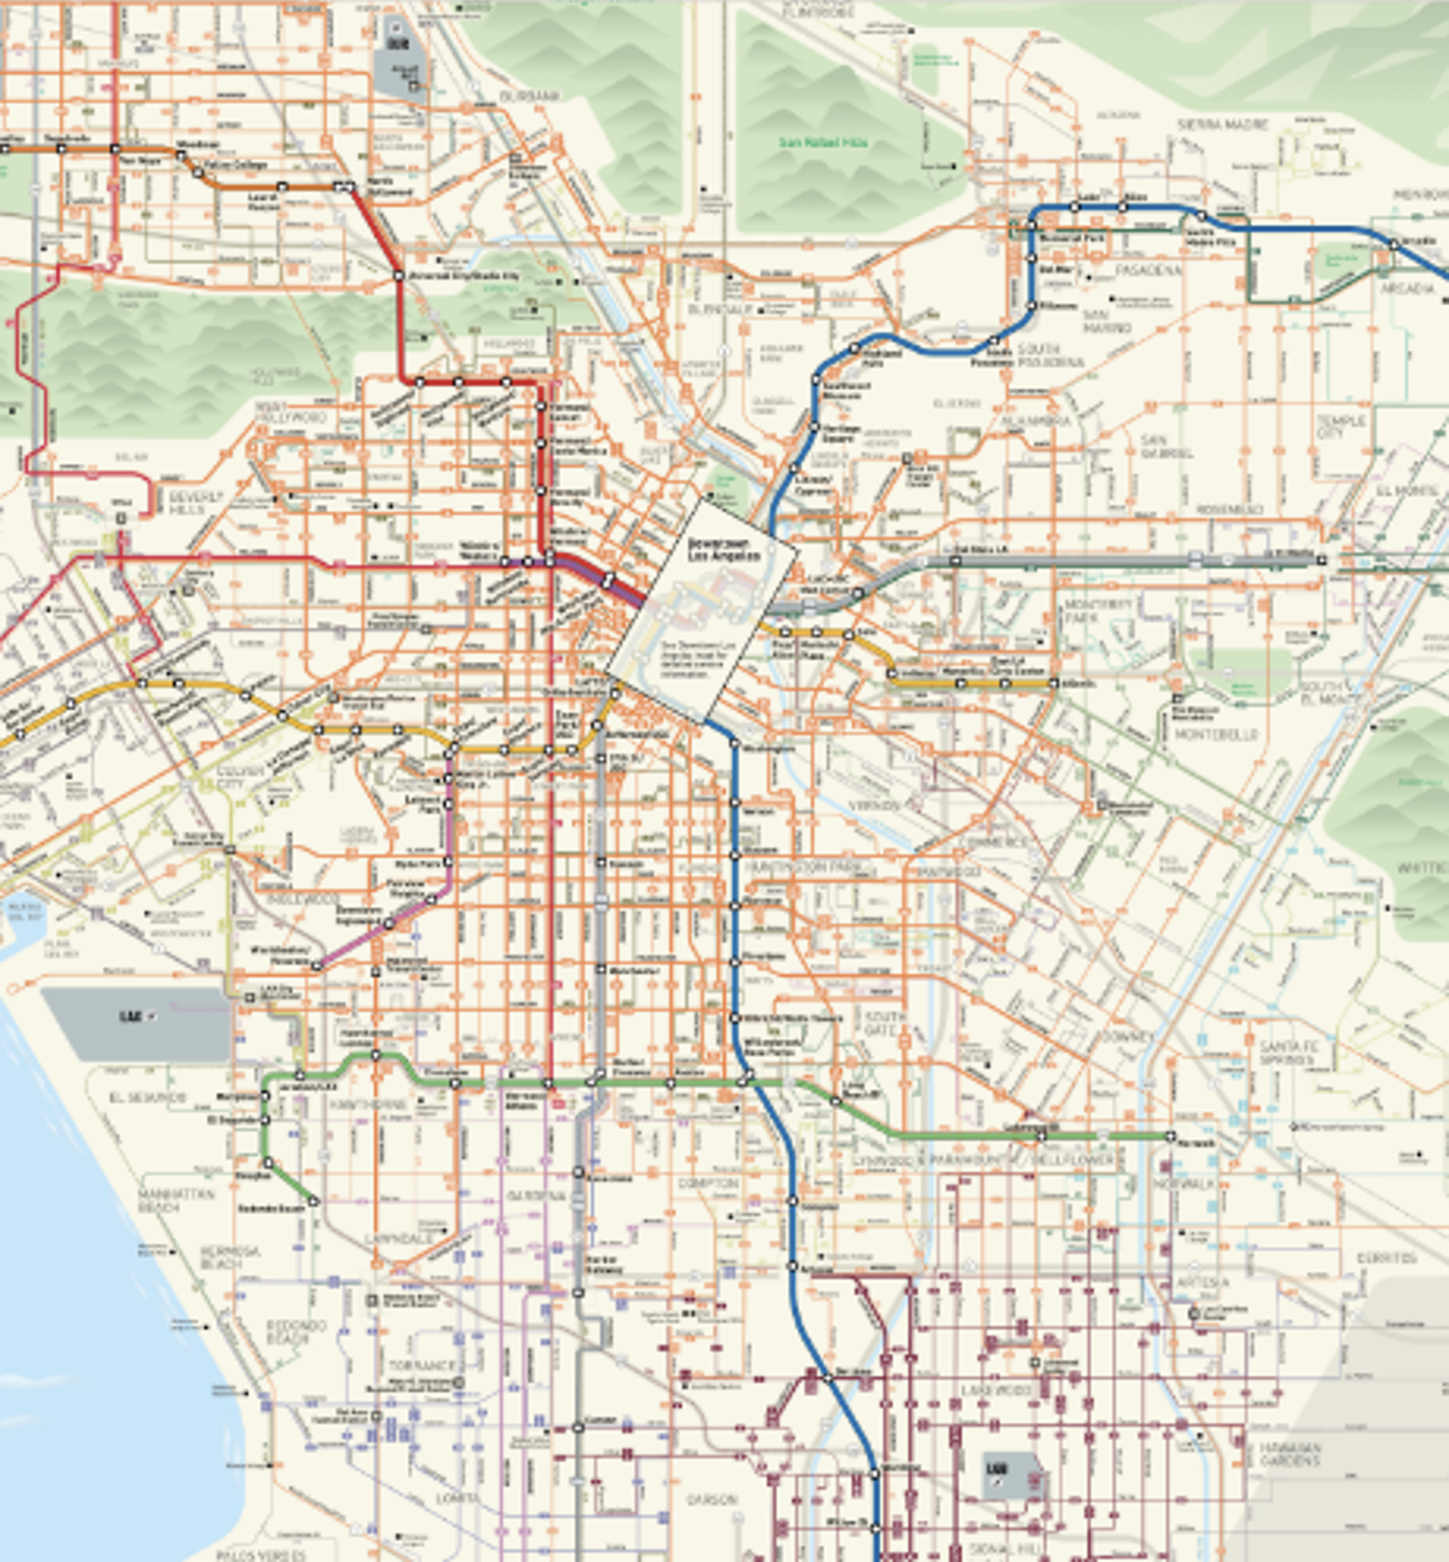
Metro’s Bus Stop Network
Metro operates or contracts with over 2,000 buses that serve approximately 12,000 bus stops across 118 bus routes and 1,447 square miles in Los Angeles. This service area spans the 88 cities and unincorporated areas that make up LA County.
Learn more about bus routes by visiting the Metro System Maps page.
Explore our GIS resources.
Metro’s Bus Stop Prioritization Analysis
Metro is committed to supporting jurisdictions as they prioritize bus stops in the most need of improvement. In 2024, Metro led a round of GIS-based analysis to score and rank bus stops in greatest need of improvements. This analysis represents just one method for analyzing and prioritizing bus stops in a region; municipalities can undergo similar types of analysis to select bus stops for improvements in their own respective jurisdictions.
Methodology
Metro evaluated all 12,003 bus stops serviced by Metro across LA County at the time of analysis. GIS was used to overlay stops with data related to a list of 9 criteria. Points were assigned for each criterion per bus stop, weighted to a maximum of 5-15 points depending on the criterion. Points were totaled to a score of 0-100.
The 2024 analysis produced a list of 1,200 stops, the top 10% of bus stops in greatest need of improvements.
Disclaimers
- This analysis represents Metro bus stop data from a snapshot in time (March 2024).
- Evaluation criteria were selected through collaboration between Metro’s Office of the CEO, Office of Equity and Race and Office of Sustainability, among other key stakeholders. They represent one way of prioritizing bus stop improvements. Individual jurisdictions may decide upon alternative methodologies for developing their own bus stop priorities.
This analysis also resulted in maps and datasets specific to each criterion for users to reference and/or download. For those familiar with GIS platforms, shapefiles, KMZ and CSV files are available for each of the 10 analyses. A brief explainer document describing this analysis is also available. Please email busstophub@metro.net to request these materials. Note: the resources shown here are subject to change.

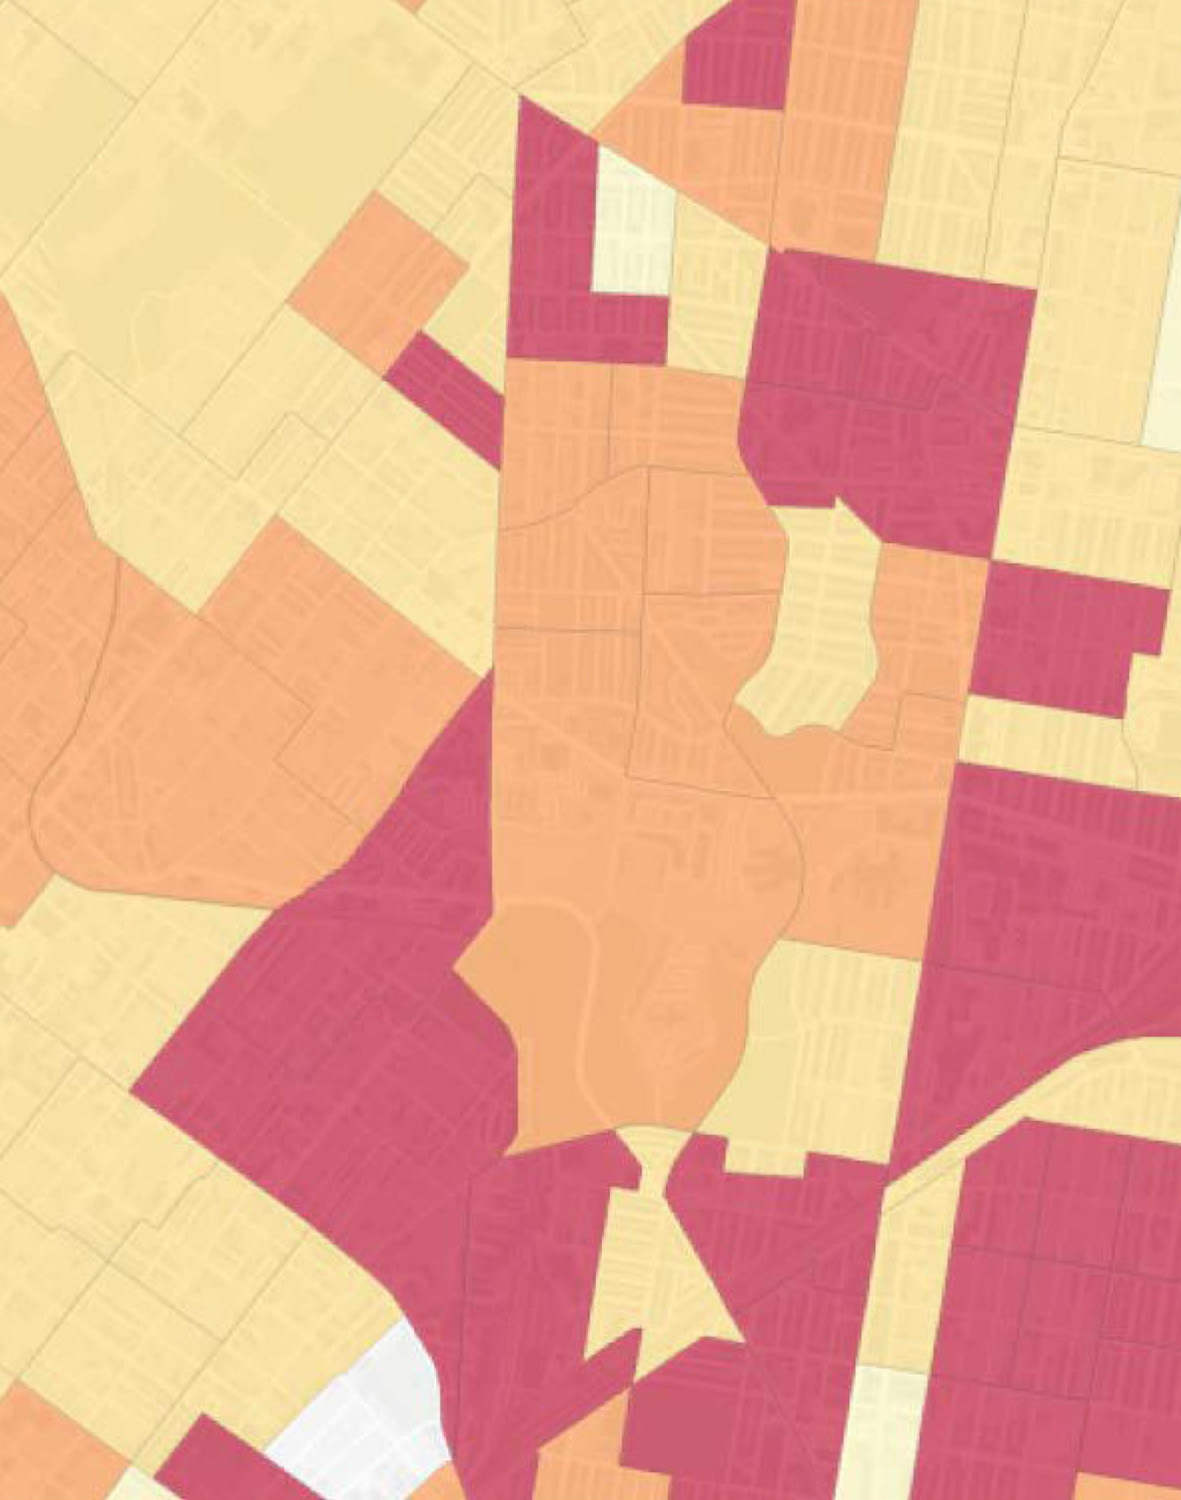
2024 Critical Need Bus Stops (Top 10% Highest Scoring Bus Stops)
Data Source: LA Metro, 2024
The 10% highest-scoring stops according to the weighted totals of all 9 criteria combined, indicating the greatest need of improvement.
Equity Focus Communities (Metro Data)
Data Source: LA Metro, 2022
Stops with scores ranging from 2-10 points depending on their level of MENI designation. MENI levels are derived from Metro’s EFC dataset, the agency’s designation for identifying priority transportation investments through three criteria associated with mobility barriers: (1) low-income households, (2) Black, Indigenous, or People of Color (BIPOC) populations and (3) car-free households.
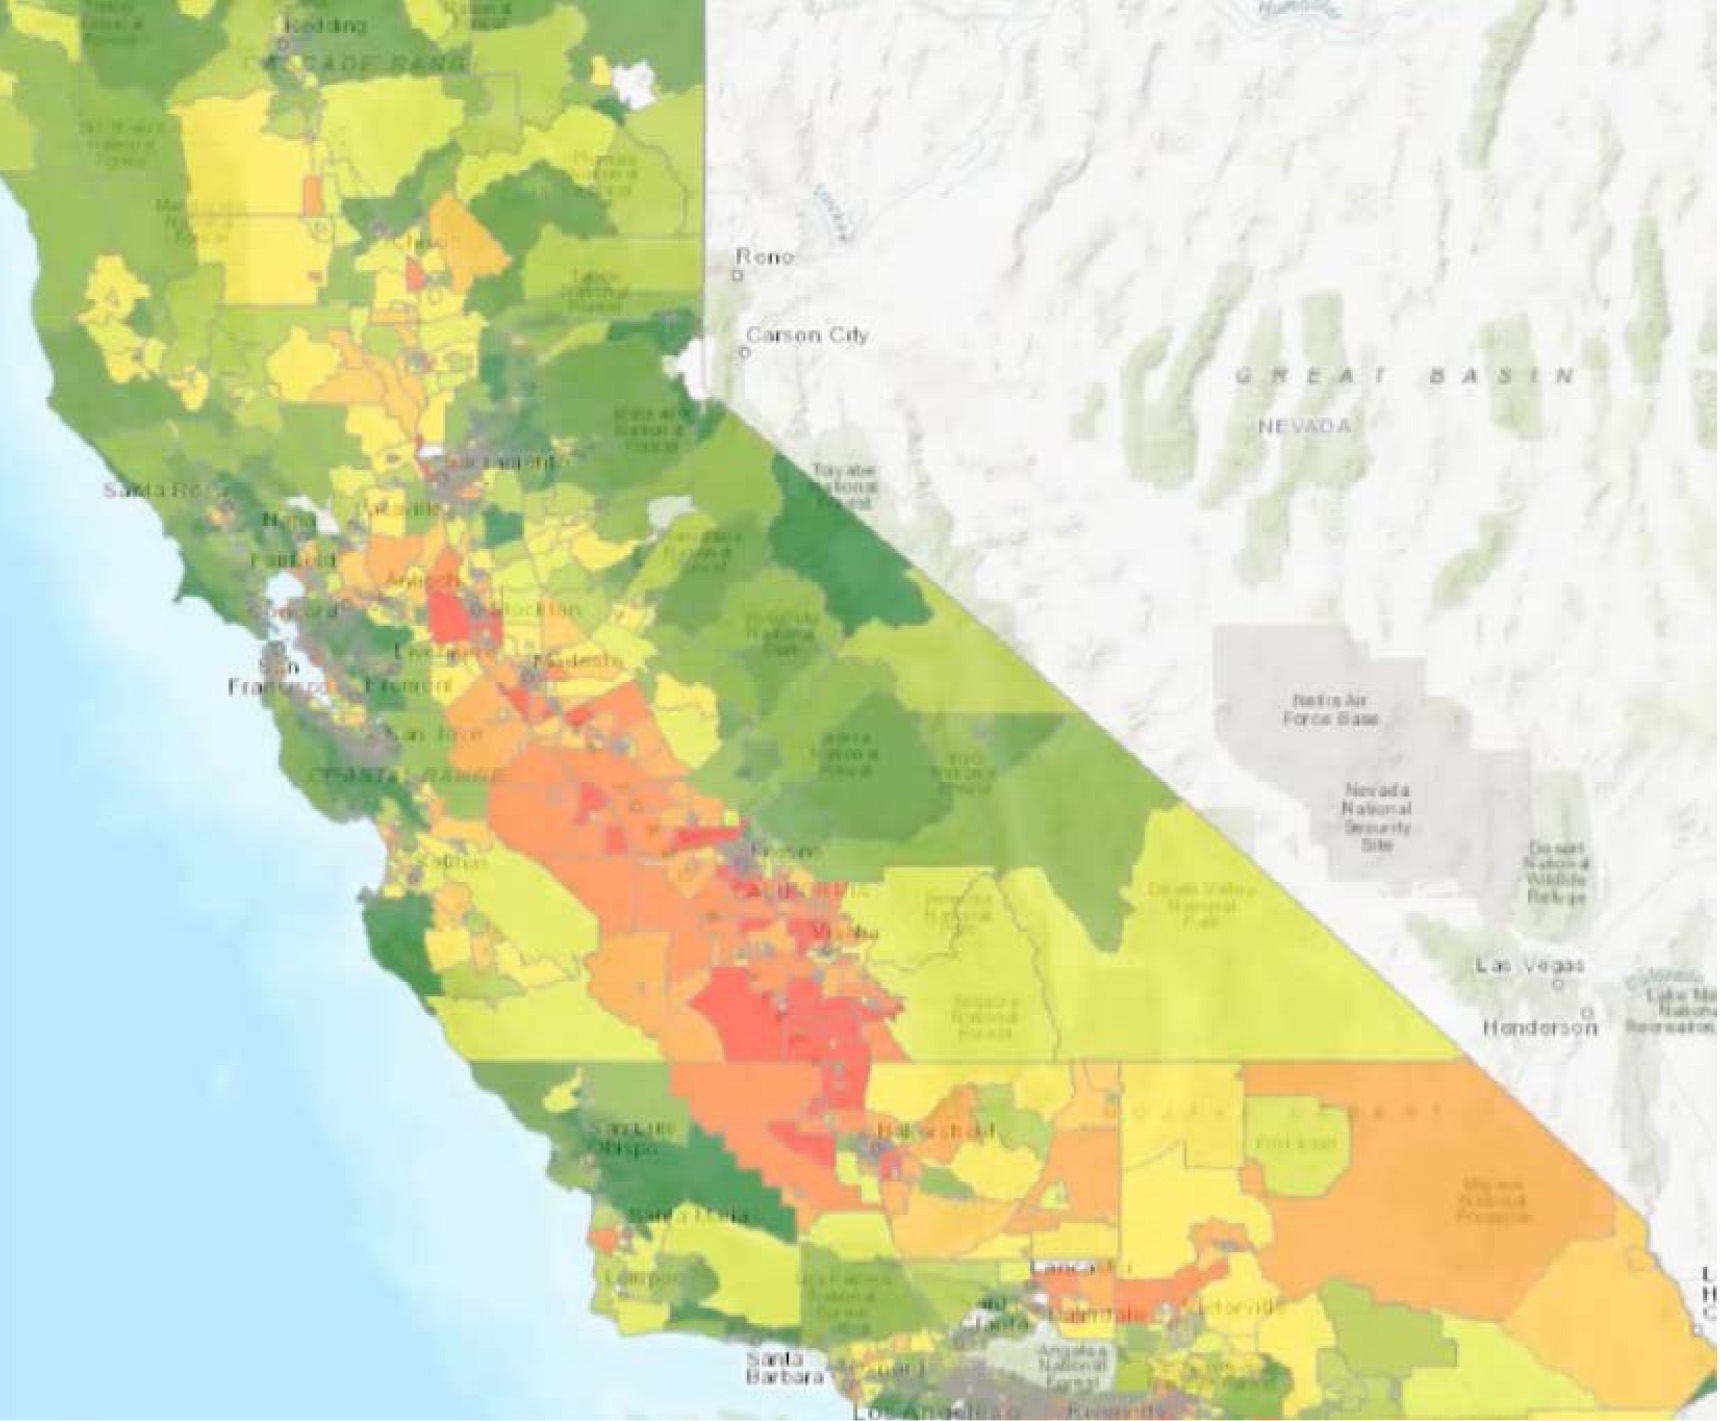
Disadvantaged Communities (SB 535 – Statewide Data)
Data Source: CalEnviroScreen, 2018/2021
Stops within census tracts representing the highest overall scores in CalEnviroScreen 4.0 and CalEnviroScreen 3.0, a statewide methodology to identify communities in California disproportionately burdened by pollution.

Communities with Vulnerable Populations (Public Health Data)
Data Source: US Census 2021 ACS 5-year estimates
Stops with scores ranging from 0-10 points based on high relative levels of three criteria associated with mobility vulnerability: (1) children aged 0-4, (2) elderly people aged 60 or greater and (3) people living with disabilities, compared to Countywide averages.
Urban Heat Island Effect – Why Shade Matters (Public Health Data)
Data Source: CalEPA, 2013
Stops with scores ranging from 0-15 points relative to the highest Urban Heat Island Index (UHII), which quantifies temperatures in degrees over the course of a day.
Tree Canopy Coverage — Greenery Near Bus Stops (Environmental Data)
Data Source: Urban Tree Canopy 2018 created by EarthDefine, based on 2018 National Agriculture Imagery Program (NAIP) aerial imagery and LiDAR data collected by the U.S. Geological Survey.
Stops with no tree canopy within 50 feet.
High Injury Network / Vision Zero (Safety Focus – Pedestrian & Cyclist Incidents)
Data Source: SCAG, 2023
Stops within 200 feet of the highest concentrations of serious and fatal auto-bike and auto-pedestrian collisions across LA County.
Historical Redlining and Housing Disparities (LA County Maps)
Data Source: Mapping Inequality, 2023
Stops in areas that received the two lowest designations for home loan risk from the federal government in the 1930s (often referred to as “redlined”) that remain in high-level MENI designations (see EFC/MENI criterion).
Communities with Low Air Quality & High Cancer Risk (Public Health Data)
Data Source: South Coast Air Quality Management District, 2021
Stops with scores ranging from 0-10 points relative to the highest possible cancer risk score based on an AQMD toxic air contaminants study.
Bus Ridership (Metro Data)
Data Source: LA Metro, 2024
Stops with scores ranging from 0-5 points based on the percentage of boardings and alightings relative to the five busiest stops serviced by Metro.

Relevant External Mapping Resources
Bus stop planners and city representatives may find a variety of additional mapping resources useful to them as they envision bus stop improvements. These resources may go beyond bus stop-specific data and include additional factors related to public health, economics and additional demographic factors. A selection of these resources is provided here.
Learn More About This Data
Interested in learning more about or downloading this data? Please contact the project team at busstophub@metro.net.